Proteomics in the Clinical Laboratory
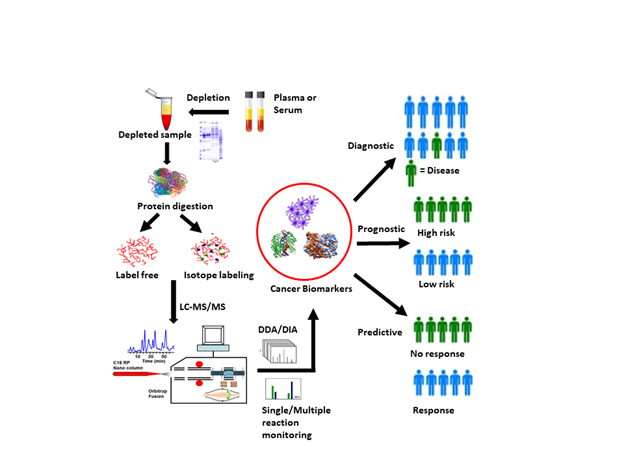
(image from: Bhawal, R.; Oberg, A.L.; Zhang, S.; Kohli, M. Challenges and Opportunities in Clinical Applications of Blood-Based Proteomics in Cancer. Cancers 2020, 12, 2428. https://doi.org/10.3390/cancers12092428)
Introduction
The announcement of the completion of the first draft of the sequence of the human genome was made by Bill Clinton and Tony Blair in the year 2000. That effectively kicked off the proteomics era. While the genetic sequence represents the genotype the protein profile reflects the phenotype, or the state of the organism. So, the race was on to catalog and measure the proteins in biological systems. Looking back, we went through a time when money was wasted, and a lot of questionable science was published. The basic rules of analytical chemistry seemed to go out the window with a lot of “discovery science” going on that was difficult to reproduce. Today we are embarking on a new era. There are instruments, reagents, and methods to measure the ten logs of protein concentration. Single cell proteomics has arrived. There is more focus on reliable, robust results that can be replicated in labs around the world.
I was fortunate to be there in the beginning. I worked at Applied Biosystems when the first draft of the genome was made public, in part, by our sister company Celera Genomics. We envisioned a “Human Proteome Project” that would change the way medicine was practiced. The promise of being able to understand disease risk, diagnose early and treat effectively is what drove all of us. So where are we today after 23 years? Not yet in the routine clinical lab. In this blog I will share my views on where we are and what needs to happen to realize the benefit, we imagined 20 years ago.
I will not pretend to be an expert in all facets of the problem. However, my journey has been unique. In the early 2000’s I formed and led a group that tried to develop and commercialize kits and methods to do Liquid Chromatography / Mass Spectrometry (LC/MS) proteomic experiments. Our first product was based on the ICAT (isotope coded affinity tags) developed by Ruedi Abersold at the University of Washington.
Some years later I helped create a business unit that focused on the clinical applications of mass spectrometry. In this case the technology could do the measurements, but the systems and methods were too complex for most clinical labs.
My last corporate job before consulting was heading up instrument development for liquid chromatography and mass spectrometry products. In this role I lived the tension between meeting the needs of the core business and creating IVD ready products.
Barriers to Adoption
There is a significant barrier between a product for the research laboratory and products for the clinical laboratory. In a recent review article on cancer biomarkers by Wenk et al described the journey.
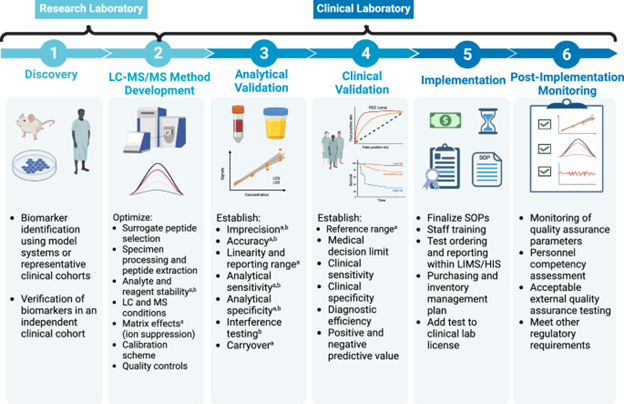
(Image from: Wenk, D., Zuo, C., Kislinger, T. et al. Recent developments in mass-spectrometry-based targeted proteomics of clinical cancer biomarkers. Clin Proteom 21, 6 (2024). https://doi.org/10.1186/s12014-024-09452-1)
The diagram describes the journey from the discovery or a biomarker or panel of biomarkers to clinical implementation. It is both expensive and time-consuming. This is not what the companies that produce analytical instrumentation are set up to do. Today they are creating the research tools used in discovery which are fine for steps one and two above.
Before a biomarker panel can be used in routine use there are several additional steps that must be done.
- The system must be robust and simple to use, consistent with other instruments in the clinical lab.
- All development of the assay, the kit, the system, and any software must be done under a compliant quality system.
- The system, software and kit should be manufactured according to standard SOP’s and change control.
- Completing 1 and 2 analytical validations can begin followed by clinical validation.
- The entire system then must be submitted to the regulatory authorities for clearance. For a new biomarker panel this would be either the De Novo 510(k) or PMA process.
- To make the investment worthwhile the assay menu at launch must be large enough to make the amortization of the system cost on a per test basis affordable. This means that all the assays must be validated on the final instrument system before launch.
- Lastly the question of insurance coverage and payment for the test needs to be addressed. This is complete when a CPT code is assigned and a re-imbursement value for the test is established.
In practice most technology is introduced via the LDT (laboratory Developed Test) route into reference labs. In this case the lab validates the test.
No matter what, the route to market is long and expensive. 5- 10 years after the test is analytically validated is not unusual. The diagnostic companies understand this. Their business models account for it. Product life cycles for systems software and kits are exceptionally long, 20 years or longer is not unusual. All this creates substantial entry barriers.
Not surprisingly the life science tools companies have struggled with this reality. The regulatory overhead to play in space is expensive. Maintaining multiple quality systems for research tools and medical devices is hard. Creating a separate organization and waiting 10 years for a return on investment is also challenging. Diverting development resources for a prolonged period of time for a market development project has a knock-on effect in reducing resources on core business.
There have been a couple of attempts at an LC/MS clinical analyzer. Thermo introduced the Cascadian system and Sciex the Topaz analyzer. Failing to get a foothold in the clinical lab, both have been discontinued. Today after 20 years of market development LC/MS is still largely an LDT. (It should be noted that neonatal screening via direct infusion MS and pathogen ID via Maldi MS are exceptions where cleared products are available.)
The Promise
Despite the challenges the potential benefit is huge. To take one recent example, (Guo, Y., You, J., Zhang, Y. et al. Plasma proteomic profiles predict future dementia in healthy adults. Nat Aging 4, 247–260 (2024). https://doi.org/10.1038/s43587-023-00565-0) Guo et al, working with a healthy cohort of 50,000 samples from the UK Biobank used the O-Link Explore Proximity Assay to look at 1400 proteins over 14 years. Their work showed that dementia risk could be predicted 10 years before symptoms. The implication is that early diagnosis could prevent or slow down the arrival of cognitive decay.
A simple PubMed search shows the interest in the clinical application of proteomics.
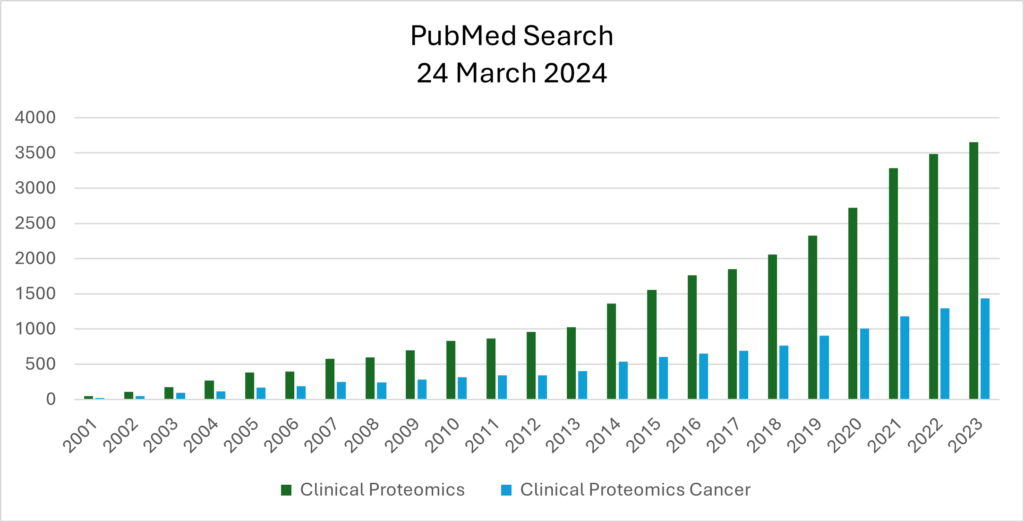
The work in clinical proteomics is increasing with cancer markers of particular interest. Imagine early diagnosis of cancer and being able to do longitudinal studies as treatment progresses all without biopsy.
The way forward
I hope I’ve made it clear that there is both great opportunity to impact human health and a long complex expensive road to get there.
So, what do I think will happen? The dementia paper cited earlier is a watershed moment. It shows the promise of the O-link technology as a discovery, development, and potentially clinical tool. Best of all the assays can be run on existing qPCR systems. (Thermo has offered to buy O-Link for $3.1B USB)
Somalogic has also introduced an assay that enables measurements of many proteins simultaneously. Their assays can be read on microarrays on NGS (next gen sequencing) systems.
EvoSep has developed a system and consumables as a front end to Mass Spectrometry. The promise here is to make LC/MS based proteomic assays more robust while covering the full dynamic range of the proteome.
Roche has announced their intention to bring a clinical LC/MS analyzer to market. We can expect an analyzer with simple robust software with kits and reagents for a large enough assay panel to justify the cost. Shimadzu has also announced their attention to introduce a clinical MS system.
The life science tools vendors including Waters, Sciex (Danaher) and Agilent are all active in the space. The vast majority of clinical LC/MS is done via LDT’s. Today LC/MS is simply too complex for the routine clinical laboratory. Creating a clinical LC/MS platform that can run proteomic biomarker panels is a long expensive journey. The EvoSep product is a step in the right direction, simplifying and standardizing the sample processing work.
These tools will enable translational science to be done to bring proteomic biomarkers to the clinic. I do not know which technology wins at the end of the day. For reason mentioned earlier I think it will be hard for the existing LC/MS providers to make the leap. But I can say that our ability to run proteomic experiments reliably in the clinical lab is getting closer. In the short run, having broadly accessible tools that can run large-scale validation experiments will drive growth in both discovery and validation work. After 20 years of work, the problems that seemed almost insurmountable at the beginning are being addressed.
Return on Invested Capital for the Life Science Tools Companies

ROIC measures how well a company uses its investors’ money to create returns. A high ROIC indicates efficient capital allocation, while a low ROIC suggests the company might be wasting resources. ROIC is calculated by dividing the companies NOPAT (net operating profit after tax) by the invested capital. It goes beyond just profitability (like Return on Equity or ROE) by considering both the company’s earnings and the capital used to generate them. This provides a more complete picture of financial health. It helps identify companies that are creating value for their investors by exceeding their weighted average cost of capital (WACC), the average return expected by investors. A company consistently generating ROIC above WACC is creating sustainable value. Economic profit (EP) is determined by subtracting WACC from ROIC.
Let us look at the Life science tools companies.
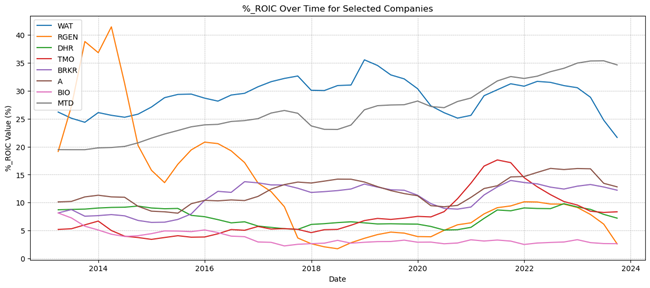
Mettler Toledo and Waters are clearly separated from the other companies with an ROIC of over 20%. Mettler has trended up over the past decade and is now showing an ROIC of 35%. Waters’ ROIC has been near 30% for the past decade, declining recently to the mid-twenties. All the other companies are under 15%.
Next, I calculated the WACC for the companies using the performance of this group to determine cost of equity. That is, the expectation for the return on equity for these companies was set based on their average performance over time. The “Economic Performance,” % EP looks like this:
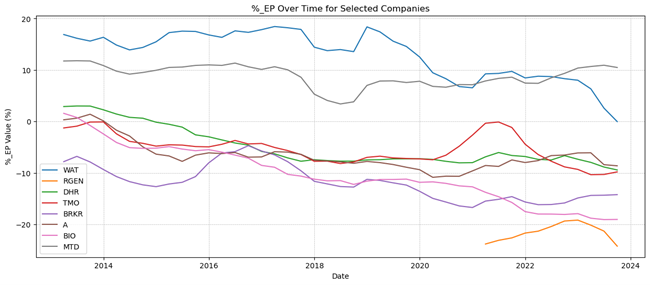
The strict interpretation of this is that only Mettler and Waters are exceeding their cost of capital. Admittedly, this is based on an exceedingly high cost of capital that is based on the high returns these companies have generated over time.
The Life Science Tools Blog
Chapter 3
Mike Yelle
Mount Hope Consulting
China Outlook for the Life Science Tool Providers

The life science tools sector, including instruments and equipment used in research, development, and manufacturing of pharmaceuticals and other biological products, has experienced strong growth in China over the past decade. This rapid expansion has been fueled by factors like increasing healthcare spending, a growing focus on biotechnology and precision medicine, and government initiatives aimed at boosting domestic innovation. However, recent years have witnessed a deceleration in growth, raising questions about future growth. As we enter 2024 the question is what happens next, a resumption of the growth trends from the past or a transition to a slower growth opportunity in the tools sector?
Attacking the Problem
For all the companies in the sector the first question is the cause of the slowdown. Is share eroding? Or is it simply macroeconomic?
For my analysis I first sought to understand the macroeconomic impact on revenues. Fortunately, most companies report a geographic segmentation of their revenue in their 10K under “Financial Notes”. I used the IMF October forecasts for the GDP data. I also chose to look at the results for the US and China since most companies report both.
Macroeconomic Context
Here is a picture of the performance of the US and Chinese economies over the past 20 years.
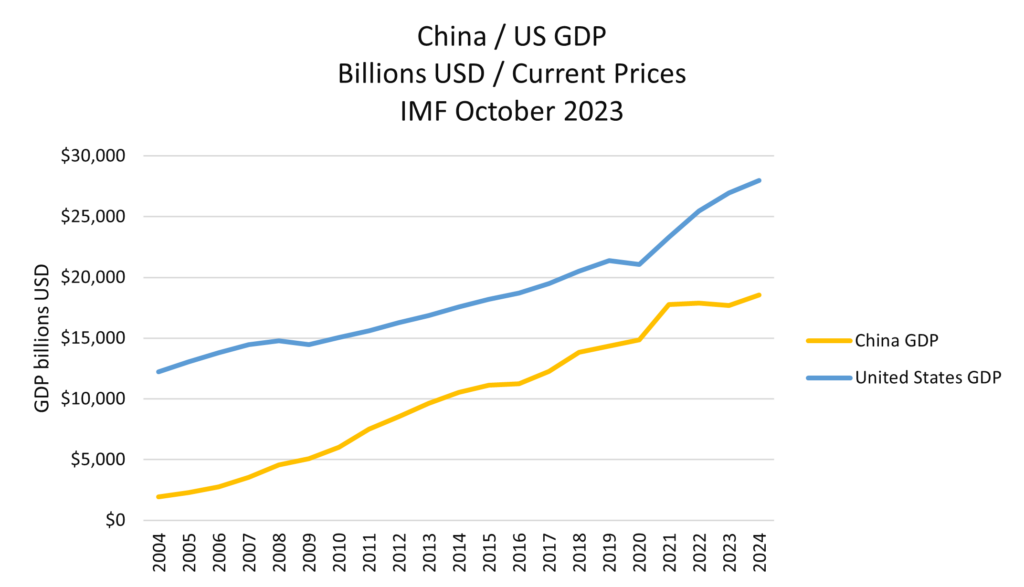
It should be noted that the data for 2023 and 2024 are forecasts. It is also expected that the 2022 data for China will be revised. Nonetheless, the performance of the two economies post pandemic differs. The US continues to grow in 2022, 2023 and 2024 while China slows in 2022 and 2023 and resumes growing in 2024. What might this mean for the tool providers?
Impact of Macroeconomic Environment on the Tool Providers
Let’s first look at the trends in company revenue and GDP. I will start the largest company, Thermo.
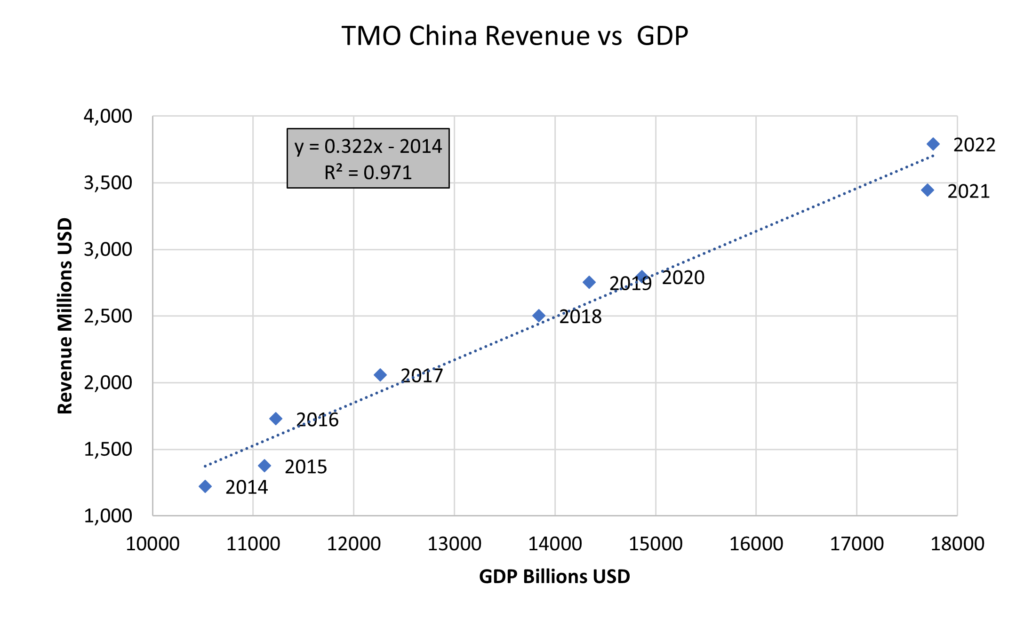
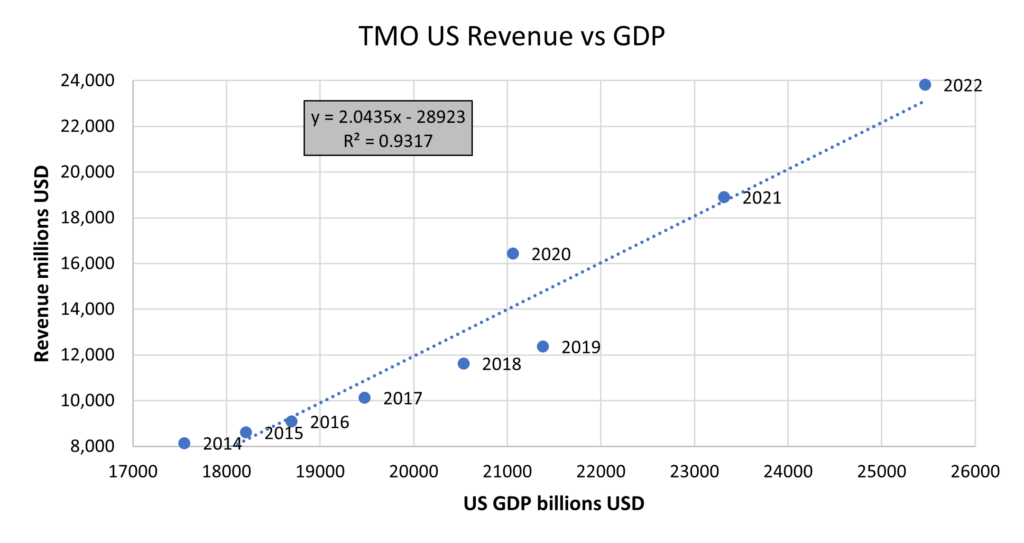
In both cases local revenue is highly correlated with GDP. In the China the correlation with GDP is 97% in the US the correlation is 93%. This is unusually high. Literally the implication is that 97% of the TMO revnue in China can be explained by GDP in China over the time period. Likewise 93% of the US revenue can be explained by US GDP. This also implies a stable share percentage in both countries over the time period. That is, the revenue per unit GDP is constant.
I was able to compile similar data for Waters, Bruker, Danaher, Agilent and Mettler Toledo.
Waters
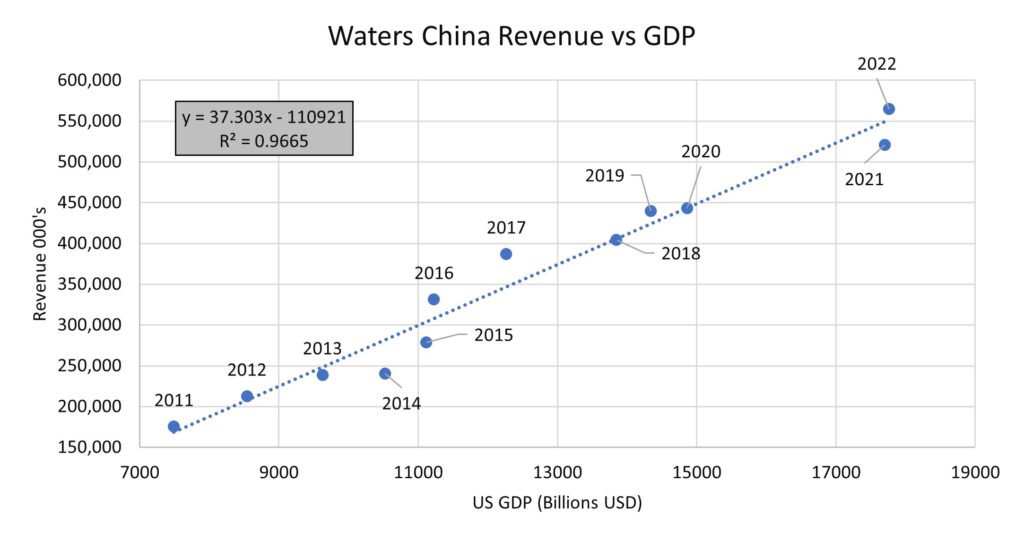
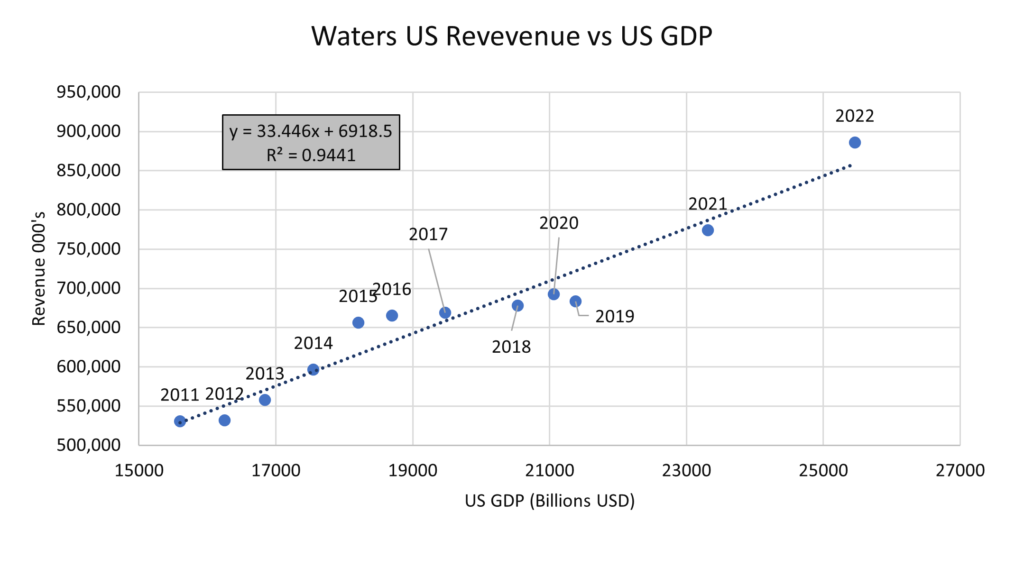
Similar to TMO, WAT accelrated out of the pandemic in the US holding steady in China. WAT results are also highly correlated with GDP with 97% in the US and 94% in China.
Bruker
Bruker does not report China separetly in their 10K so I had to settle for Asia.
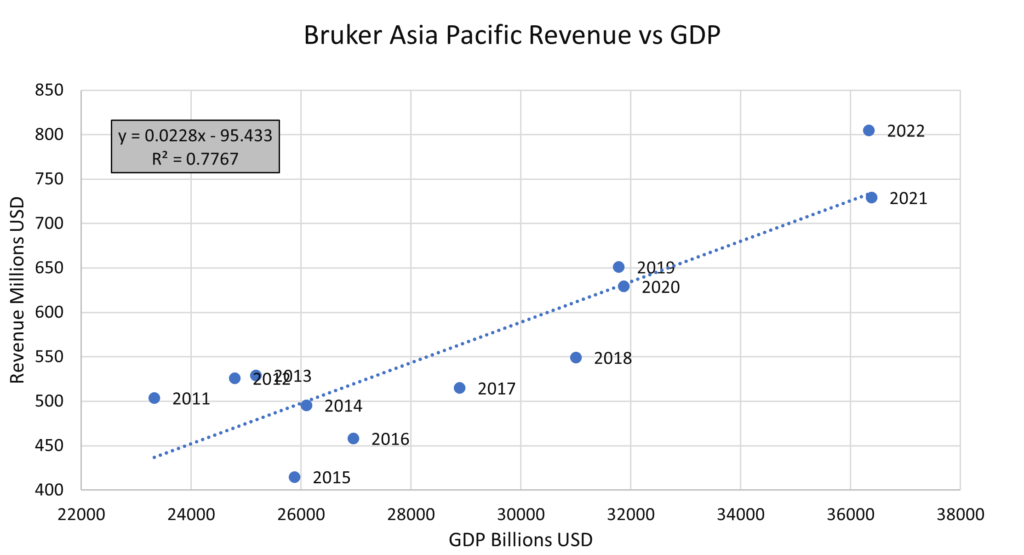
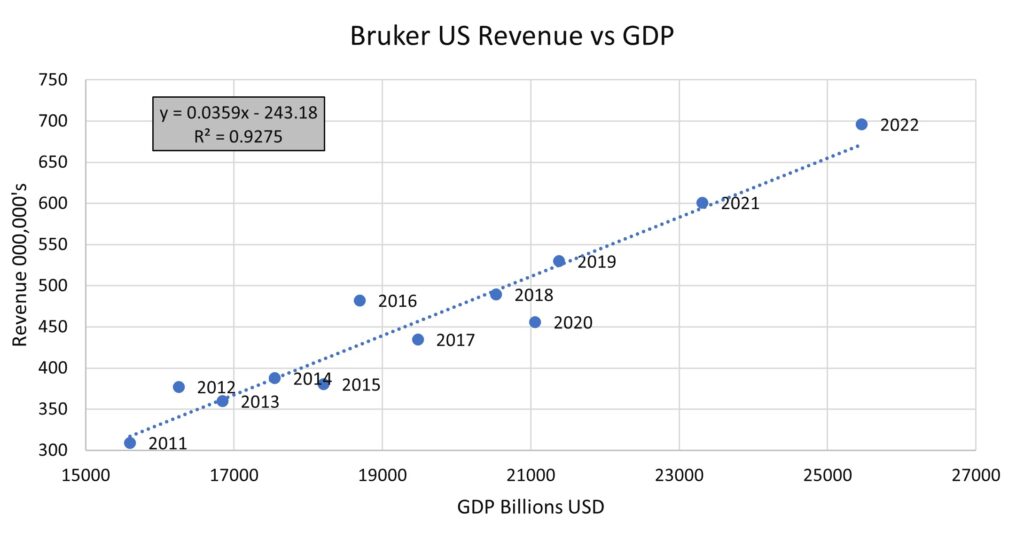
Bruker also accelerated out of the pandemic and maintained momentum in Asia. The corrlation was somewhat weaker than TMO or WAT for Asia at 78%. The US was highly corrrelated with GDP at 93%.
Danaher
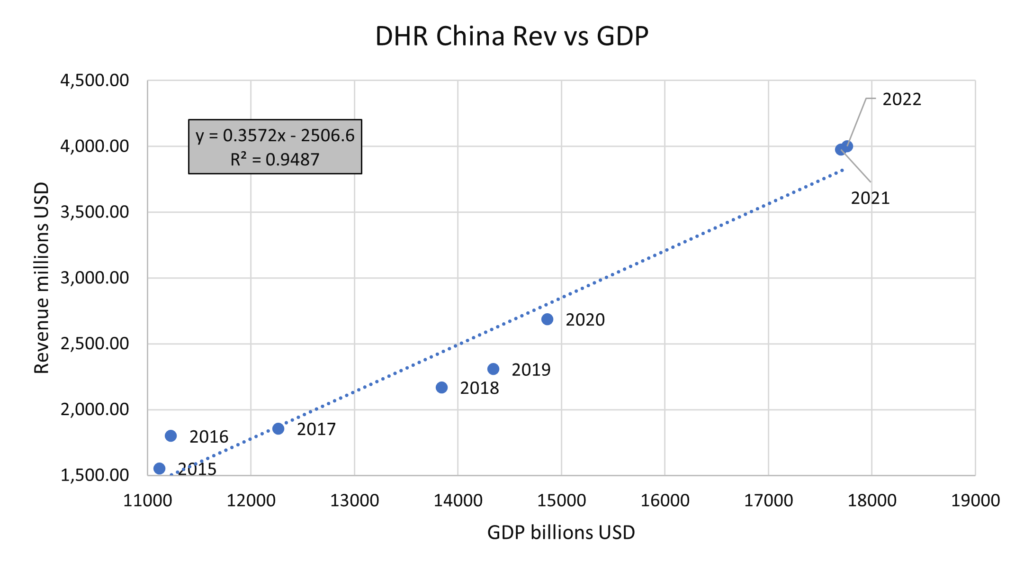
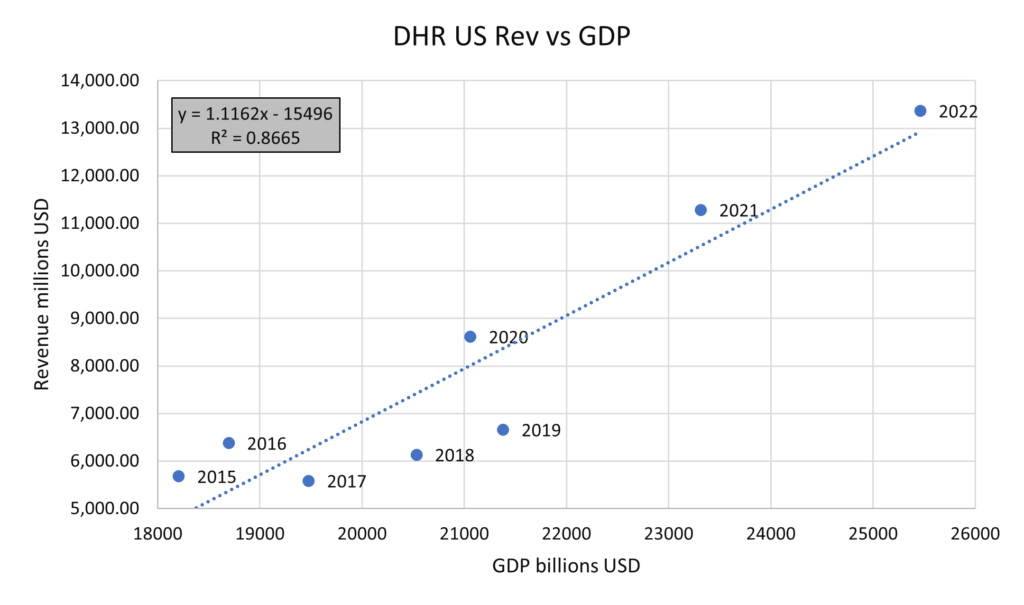
In this case of Danaher we see the same acceleration in the US with a flattening in China. This most probably is caused by COVID specific spending that slowed.
Correlations were high with GDP in the US and China at 95% and 87% respectively.
Mettler Toledo
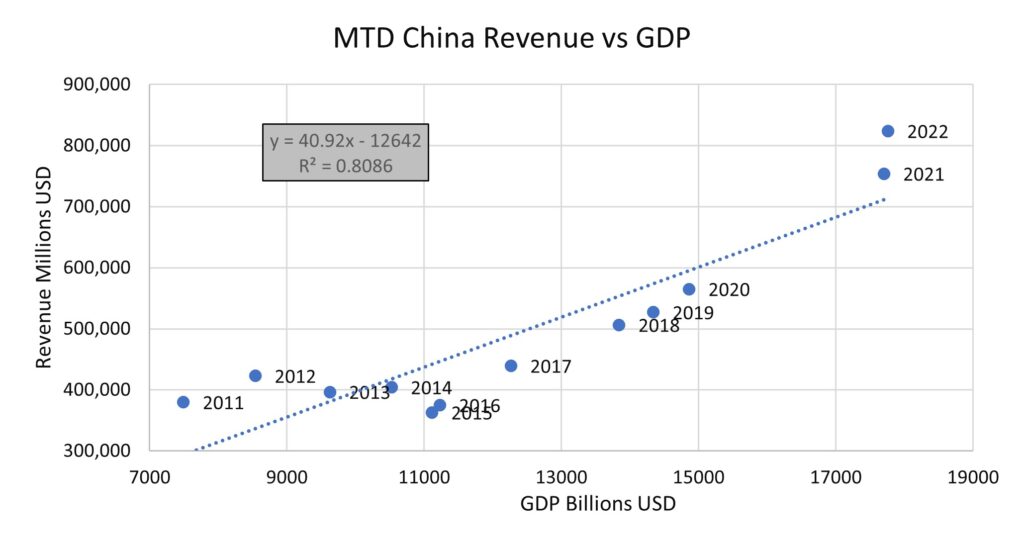
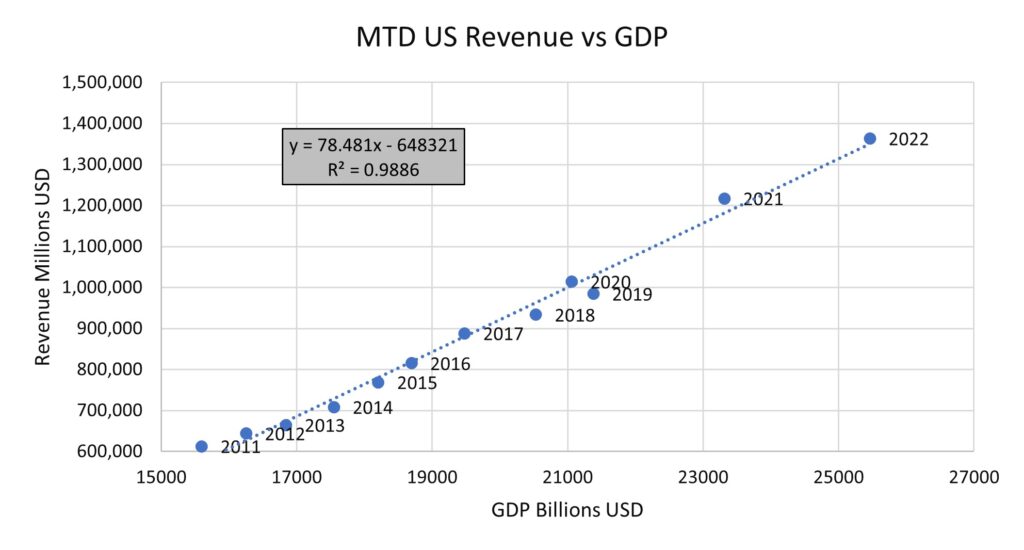
Mettler results are similar to Danaher with strong growth in US and a softening in China. The China correlation is 80%. Looking closly at the data it is plain that the business was indecline in China 2011 through 2016. Since that time it has accelerated strongly. This indicates something other than GDP driving results.
Agilent
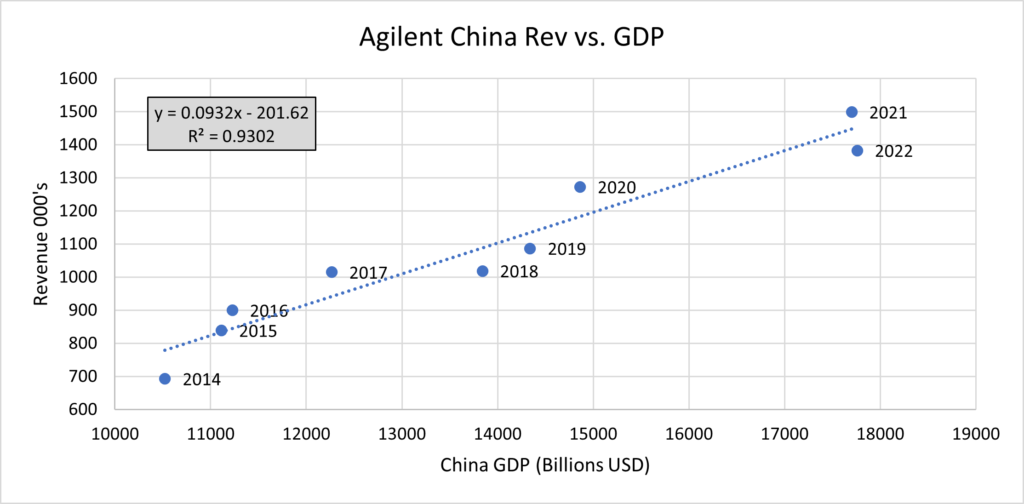
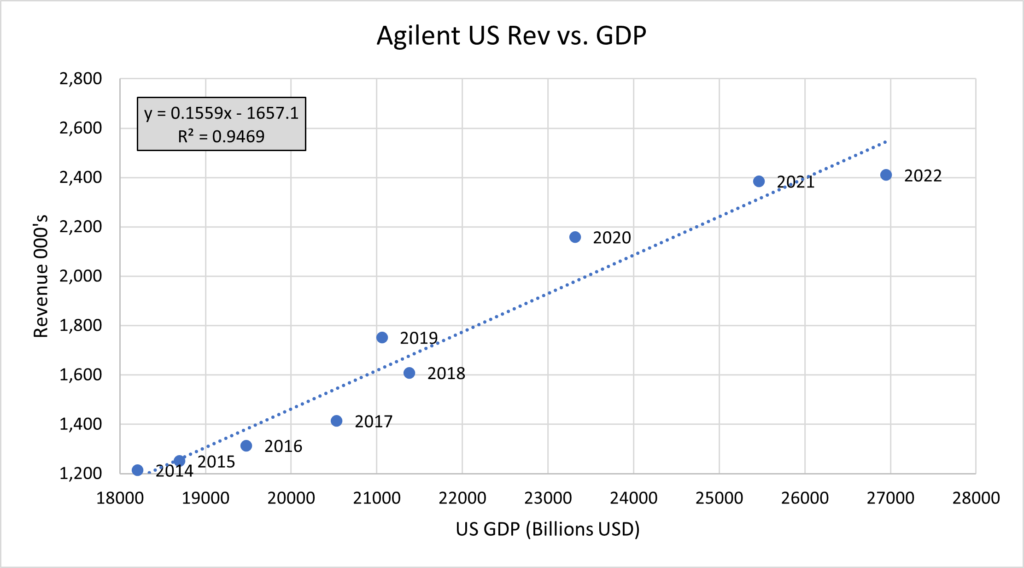
Agilent spun out it’s electronic measurement business in 2013 so only results after were considered. For the US and China the results are highly correlated with GDP.
China in 2024
The IMF, World Bank and OECD are all forecating China to grow around 5% in 2024. There are a number of factors that support growth. The government has the capacity to spend to boost the economy. Local consumption should improve. The housing market should bottom and stabilize. Tensions with the US appear to be easing. On the risk side China is still burned with opaque debt at the local government level. Real estate remains shaky. Trade tensions may increase. Taiwan remains a large and uncertain risk. My own view is that the risks are on the downside.
Conslusion
I’ve summarized the correlations below.
Company | R Squared – Revenue vs GDP | |
US | China | |
TMO | 0.93 | 0.97 |
WAT | 0.94 | 0.97 |
BRKR US / (Asia/Pac) | 0.93 | 0.78 |
MTD | 0.99 | 0.81 |
A | 0.95 | 0.93 |
DHR | 0.87 | 0.95 |
It is apparent that all these companies are highly dependent on the GPD in the US and China. I do find the strength of the correlation surprising. Forecasts for China and the US are about 5% and 6% respectively. Absent any major macroeconomic crises this would be a good place to start for 2024 revenue forecasts.
The Life Science Tools Blog
Chapter 2
Mike Yelle
Macroeconomic impact on Revenue of Tool Providers

In my first blog (here: https://mthopeconsulting.com/life-science-tools-blog/ ) I reviewed the performance of eight tool providers, Agilent, Waters, Danaher, Thermo, Bruker, Repligen, BioRAD and Mettler Toledo. As a group they generated outsize returns over the past 20 years outpacing both the SP 500 and Nasdaq. In this post I will begin to look at the macroeconomic drivers of performance.
Macro-economic Drivers
Fortunately, there is much data available on-line. I was able to download a database of global GDP from the IMF (https://www.imf.org/external/datamapper/NGDPD@WEO/OEMDC/ADVEC/WEOWORLD), a database of global healthcare spend from WHO (WHO, https://apps.who.int/nha/database) and a database of global pharm spend from OECD (OECD, (https://data.oecd.org/healthres/pharmaceutical-spending.htm). The units for GDP are Billions of USD, for Health Spend they are Millions of USD and for pharm spend they are USD per capita. For revenue, the units are USD. All the macro-economic data covered the period of 2003 through 2021.
Impact of Macro-economics on Revenue
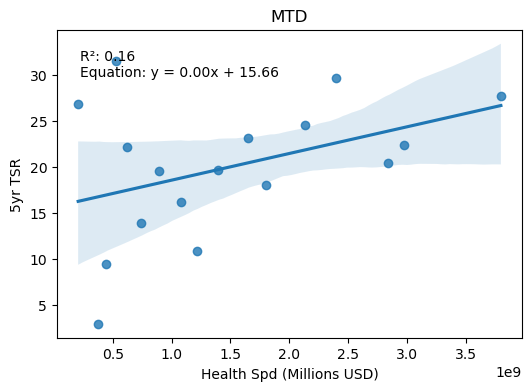
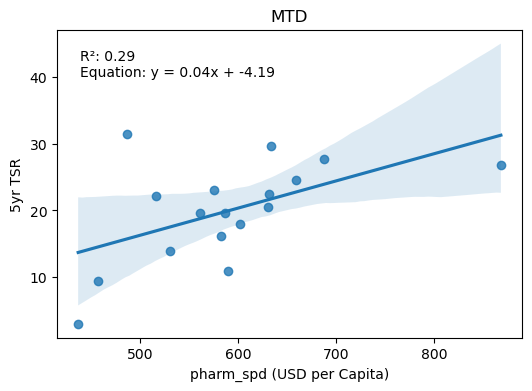
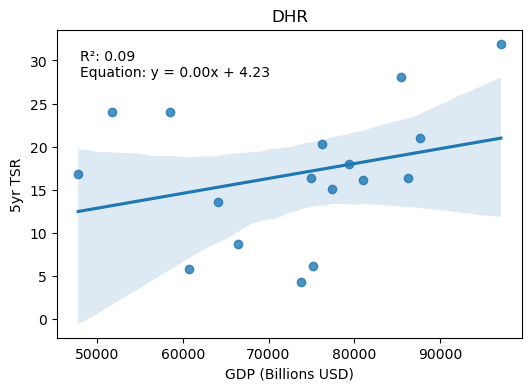
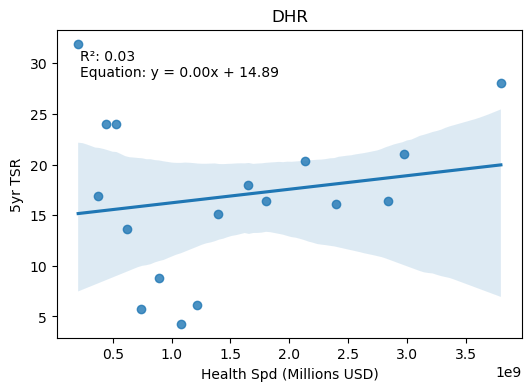
Linear regression was performed between annual Revenue and Global GDP, Global Health Spend and Global Pharma Spend for each company. On the example plots you can see the least squares line, the equation of the line and the square of the correlation coefficient. The square of the correlation coefficient is often referred to as the coefficient of determination. It describes the proportion of variation in the dependent variable, in this case revenue, which can be explained by the variation in the independent variable, in this case Global GDP. (I am showing a few examples here. You can see the complete set of plots below.
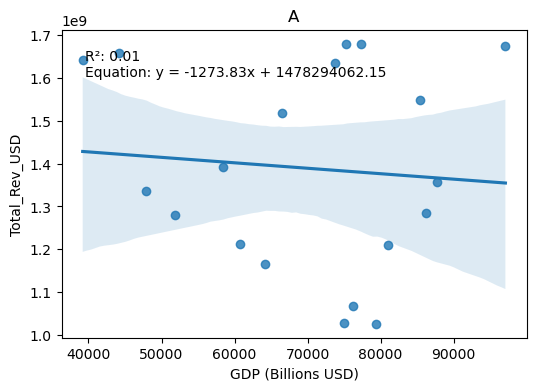

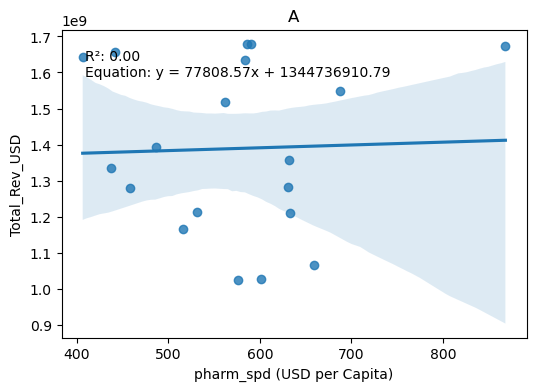
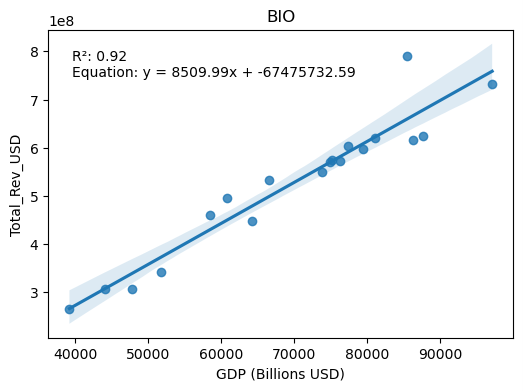
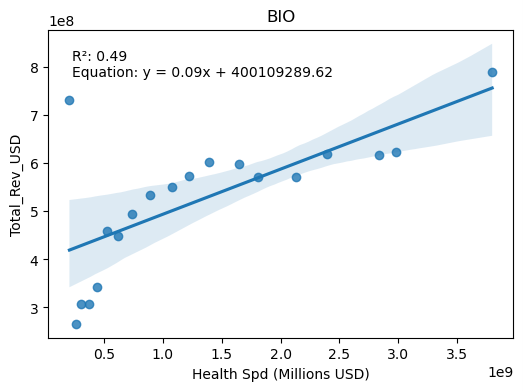
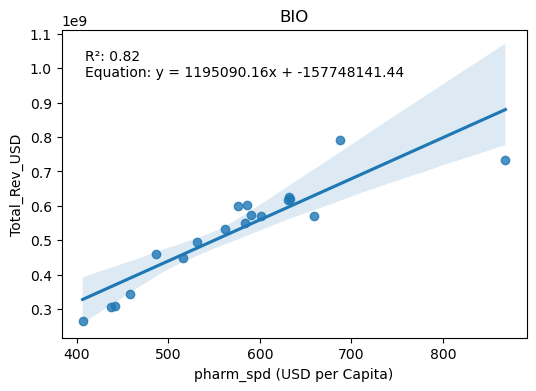
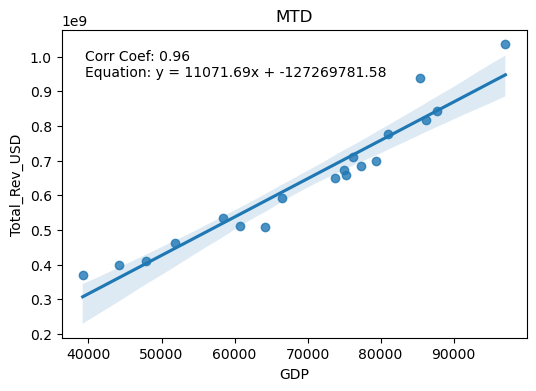
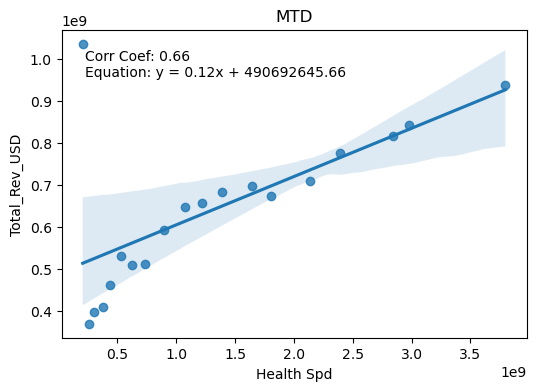
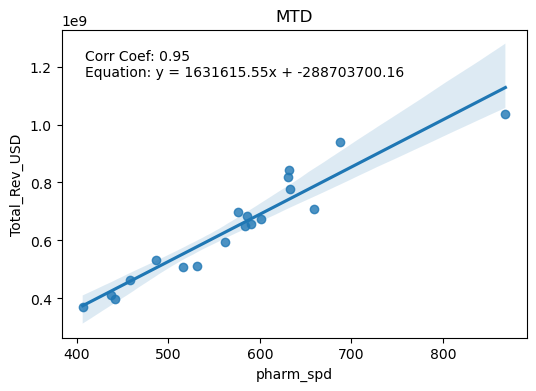
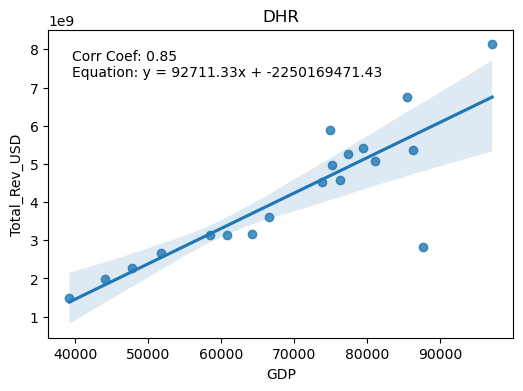
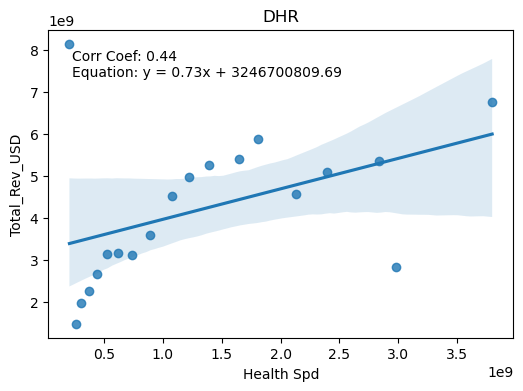
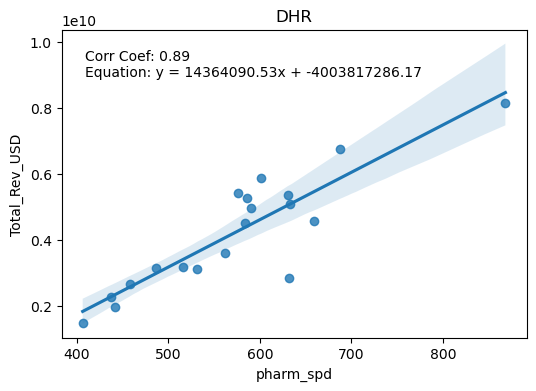
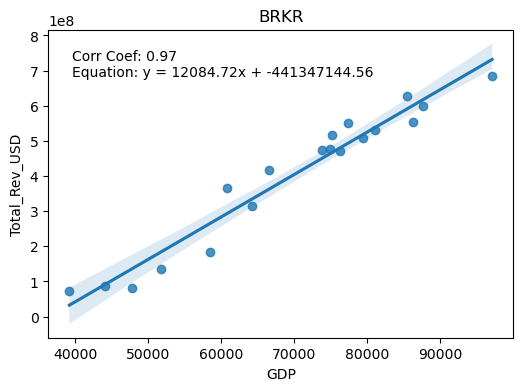
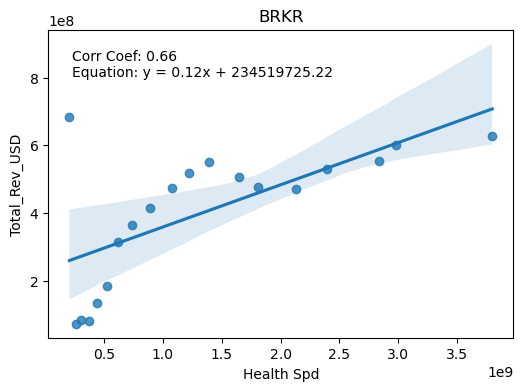
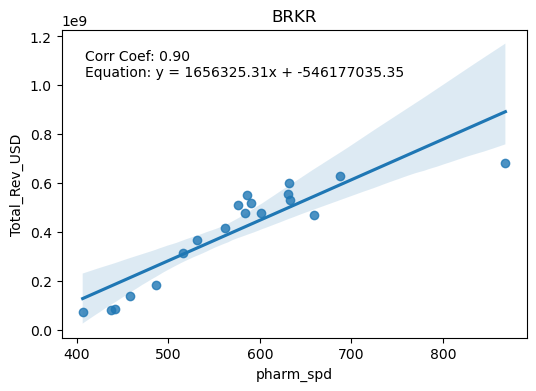
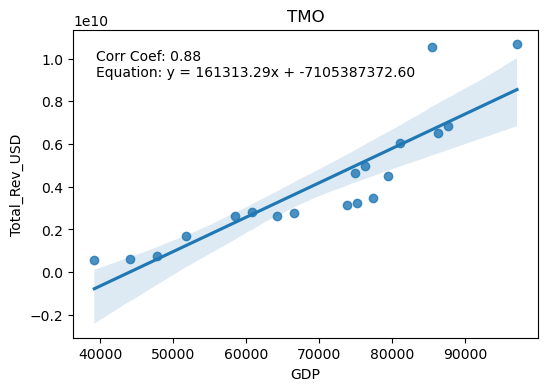
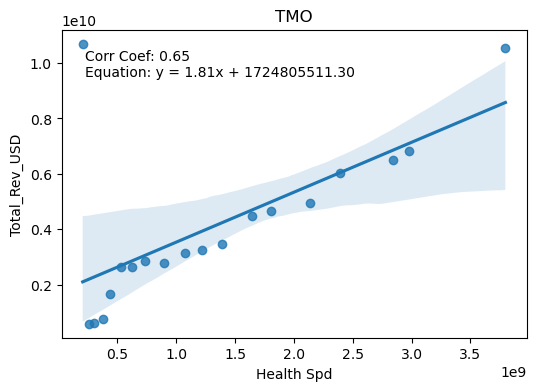
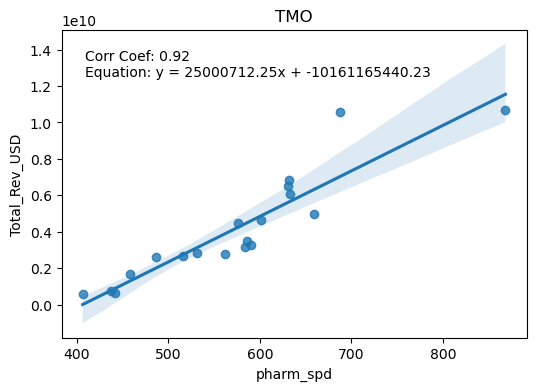
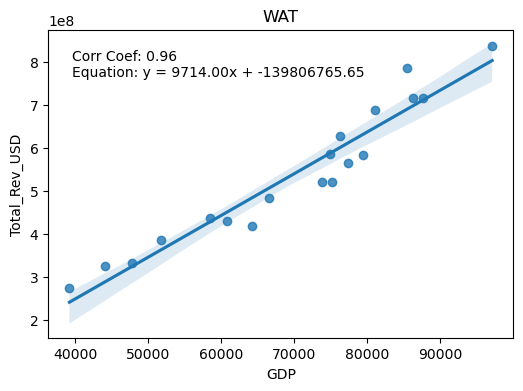
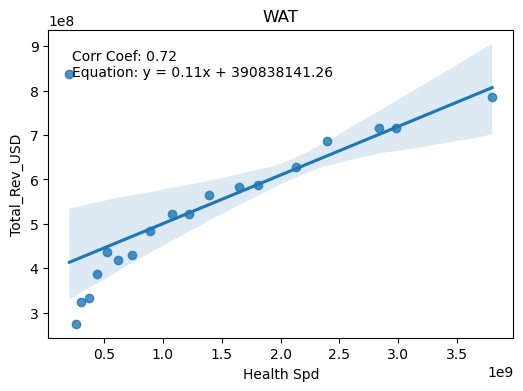
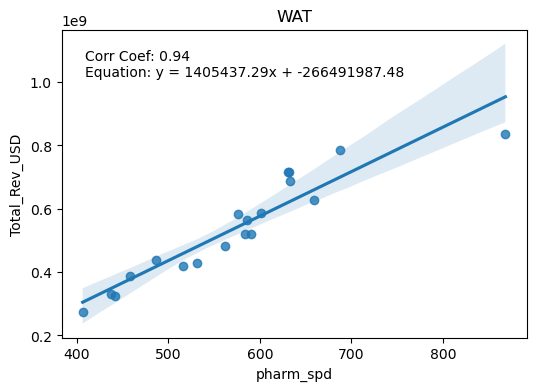
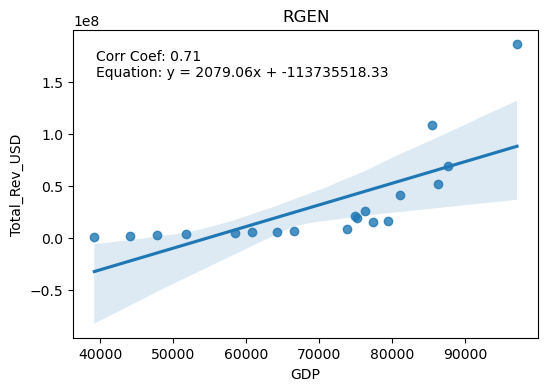
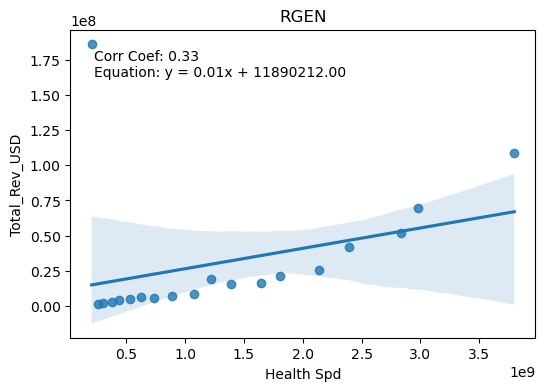
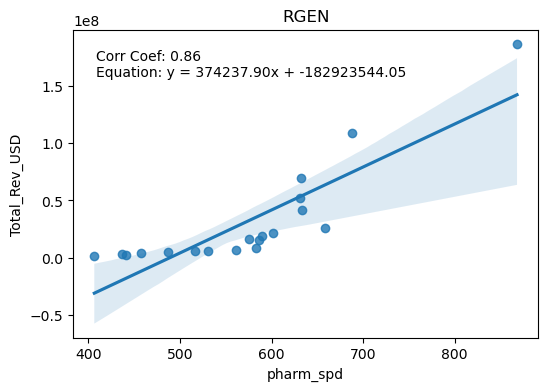
If you look down the column containing the GDP plot the strong correlation is evident for most of the companies. Interestingly Agilent shows little correlation with the macro-economic data. While BioRAD, Waters, Thermo, Danaher, Bruker and Mettler Toledo are higly correlated with GDP with R2 values greater than .85, implying that 85% plus of their revenue can be explained by GDP. There is also clearly a non-linear relationship between BioRAD’s revenue and Health Spend.
In the table below the R2 values for all the tickers and macro-economics measures are summarized. GDP and pharm spend are the best predictors of company reveneue.
Revenue vs. Macro-economicsCoefficient of Determination – “R Squared” | |||
Ticker | GDP | Health Spd | pharm_spd |
A | 0.007539 | 0.065857 | 0.001272 |
BIO | 0.91652 | 0.485431 | 0.817469 |
BRKR | 0.949811 | 0.438963 | 0.80694 |
DHR | 0.728889 | 0.193796 | 0.791295 |
MTD | 0.926204 | 0.435014 | 0.909704 |
RGEN | 0.509091 | 0.107844 | 0.746008 |
TMO | 0.777107 | 0.423049 | 0.844173 |
WAT | 0.928244 | 0.512884 | 0.878769 |
While we can debate the causality, the revenue of Waters, BioRad, Bruker, Danaher, Mettler Toledo and Thermo are highly correlated with the macro-economic environment as measured by GDP. Agilent shows little correlation and Repligen a moderate correlation with Pharm Spend. For Agilent, the result suggests that their business is less sensitive to the macro-economic environment. Repligen is the smallest fastest growing company their business is focused on Pharm so the correlation there isn’t surprising.
Impact of Macro-economics on Rolling 5 Year Total Shareholder Returns (5 YR TSR)
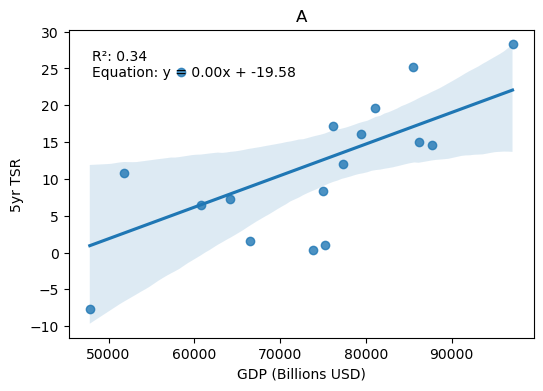
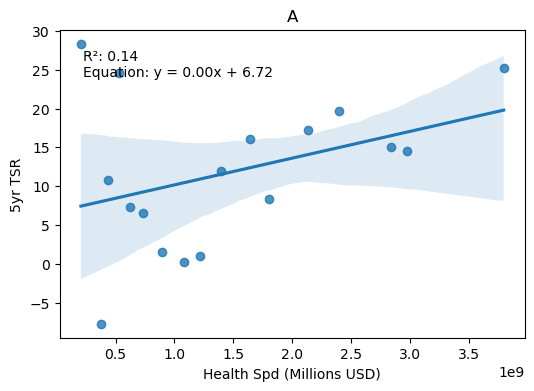
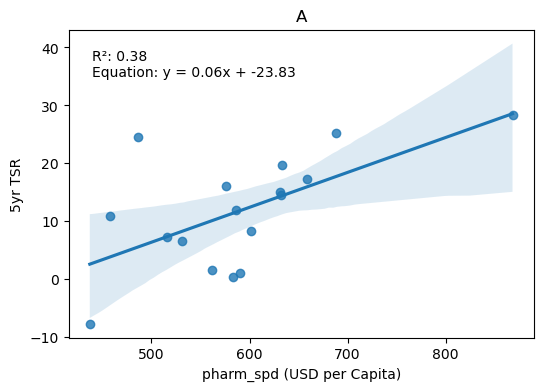
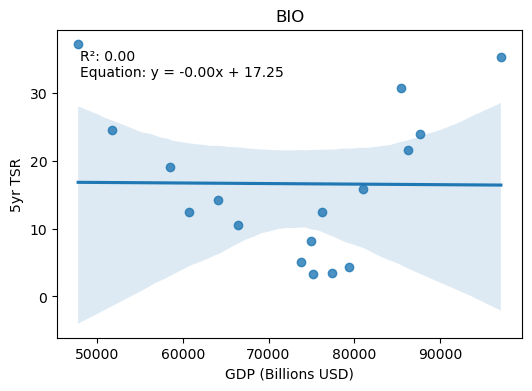
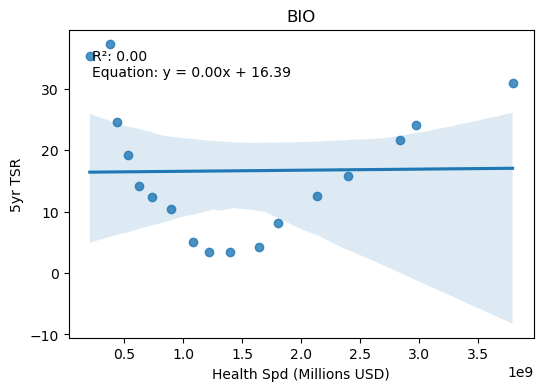
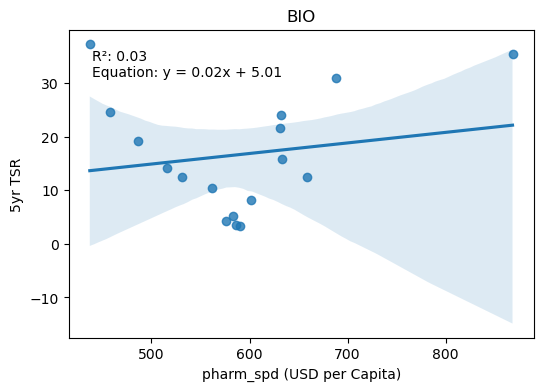
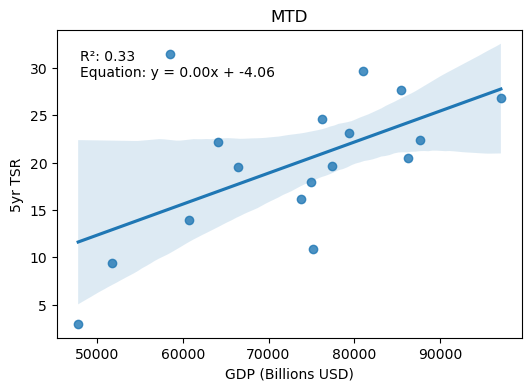
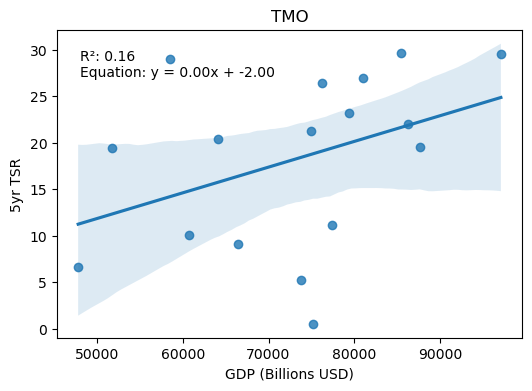
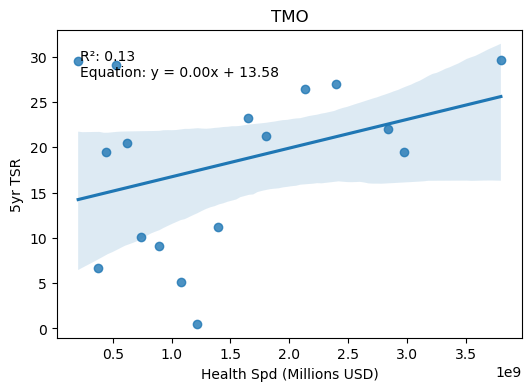
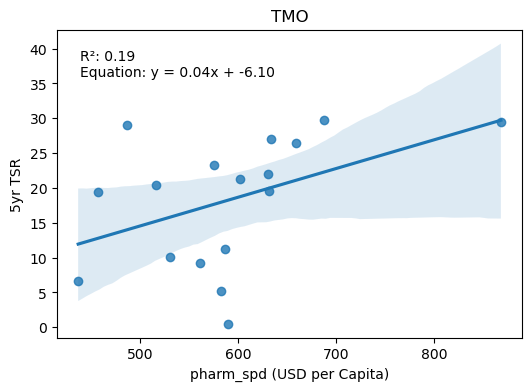
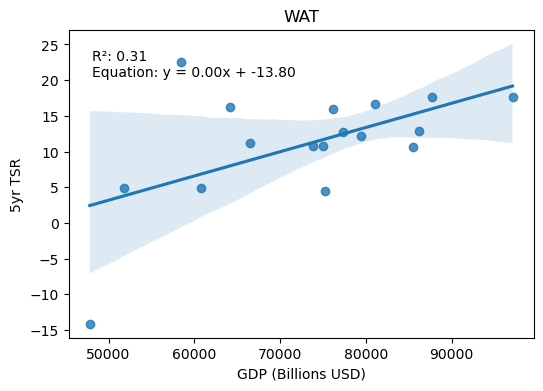
Next, I performed a similar analysis on the correlation of macro-economics with a 1 year rolling 5 YR TSR. Given the high correlation for certain companies with revenue I expected to see some correlation.
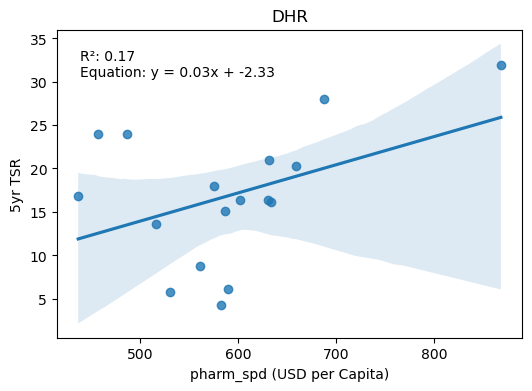
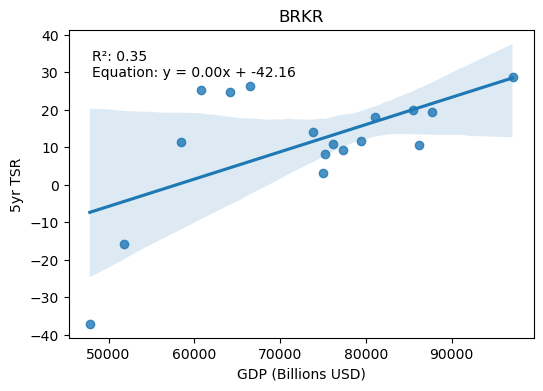
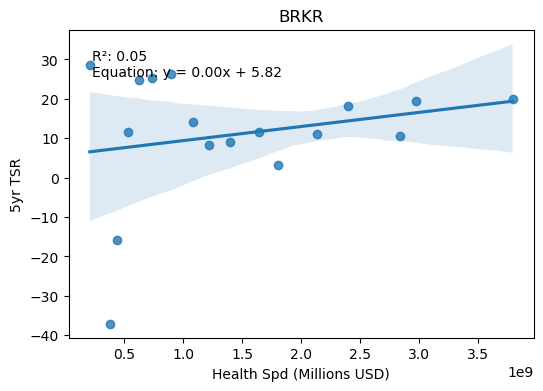
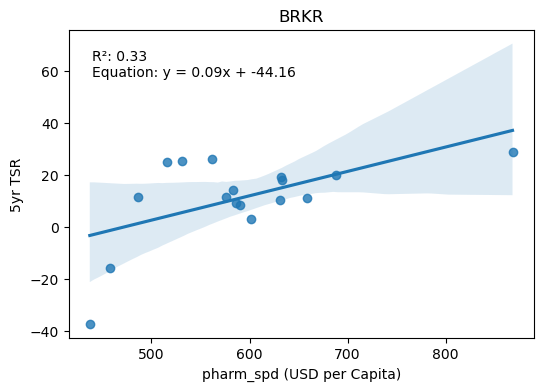
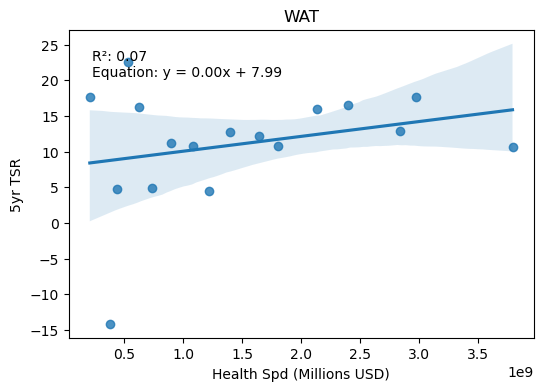
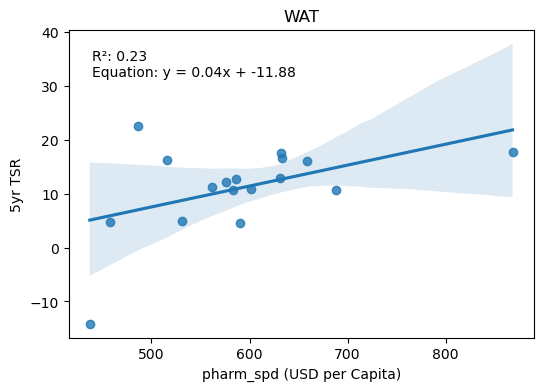
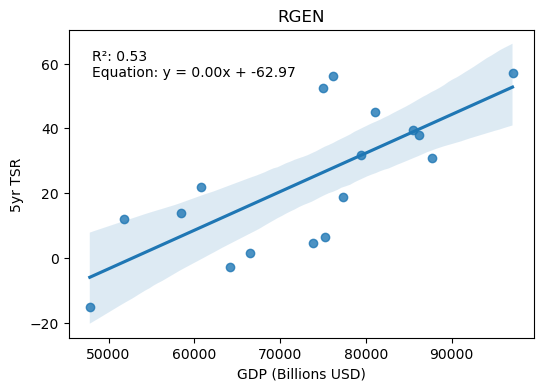
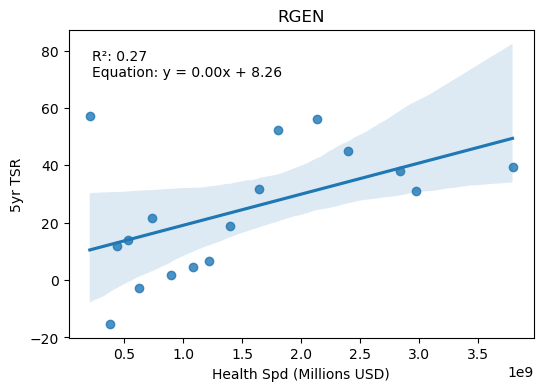
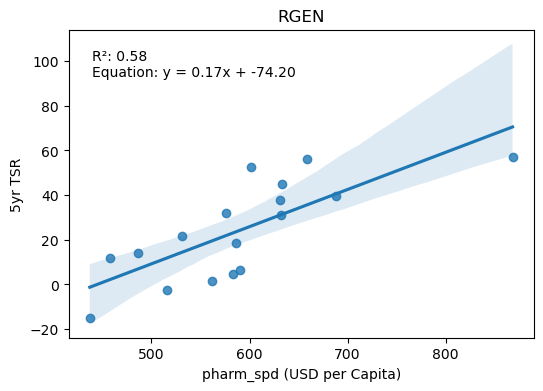
5 Year TSR vs. Macro-economics
Coefficient of Determination – “R Squared”
Ticker |
GDP |
Health Spd |
pharm_spd |
A |
0.338916 |
0.135341 |
0.375564 |
BIO |
0.000101 |
0.000283 |
0.032106 |
BRKR |
0.35329 |
0.052826 |
0.327059 |
DHR |
0.087896 |
0.032744 |
0.174551 |
MTD |
0.334274 |
0.161222 |
0.290489 |
RGEN |
0.526966 |
0.269569 |
0.577297 |
TMO |
0.156062 |
0.126591 |
0.194025 |
WAT |
0.307848 |
0.071215 |
0.225442 |
Clearly the correlations are lower for TSR, potentially reflecting the choices management make to generate shareholder returns despite the economic environment. For example, a weaker environment could result in lower revenue, but management could cut costs to maintain returns.
The plot for BioRAD showing TSR vs Health Spend is interesting. There is clearly a relationship between TSR and Health Spend, but it is not linear. It is a good example of why data should be plotted to see relationships.
Conclusion
The revenues for BioRAD, Thermo, Danaher, Mettler, Bruker, and Danaher are highly correlated with global GPD over a 19-year period. This period includes the rapid growth of China, the fiscal crisis of 2007-2008, great recession of 2008-2009 and the COVID slowdown. The plot below shows the GDP data.
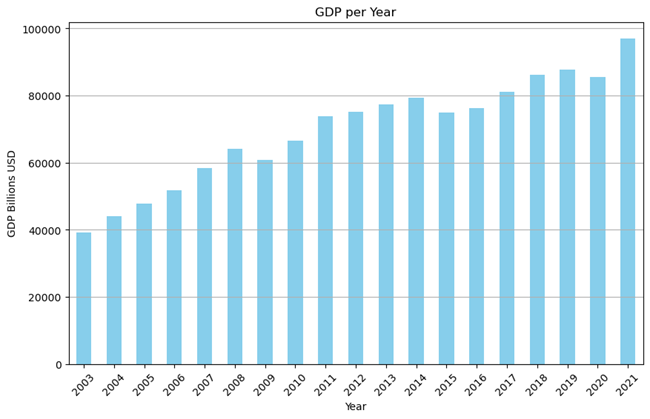
Global GDP is then a key variable for these companies in projecting future revenue. Armed with GDP forecasts companies can make more informed spending decisions to manage profitability more effectively. Investors should question forecasts that are inconsistent with GPD.
In the next analysis, I will look at the financials of the companies as predictors of shareholder returns.
If you found this blog interesting please complete the form below and “click” the button.
Life Science Tools Blog
Chapter 1
Mike Yelle
Mount Hope Consulting

The Impact of Life Science Tools on Scientific Progress
From Antonie van Leeuwenhoek using his microscope to make the first observations of bacteria through the sequencing of human DNA to recent work showing the potential to diagnose breast cancer from a fingerprint, tools have been the foundation of life science research. In my years of experience in this field, I’ve witnessed first-hand how these tools have revolutionized research and development. With emerging trends such as precision medicine and personalized healthcare, the importance of these tools is only set to increase.
In this blog series, I will explore the business and technology of the life science tools industry. My hope is to start a dialog about the promise and challenges in this important area.
The Life Science Tools Market
The life science tools market is attractive and bustling with innovation and growth. It’s a sector marked by high profitability, stringent regulations, and rapid technological advancements. Companies like those highlighted below are solving problems in life science research with their cutting-edge products.
The market includes both the broad pharmaceutical and in-vitro diagnostics segments. These segments are attractive for tools providers for several reasons:
- They exhibit consistent growth.
- They are profitable.
- They are regulated (more on this later).
- They address high-value problems driven by needs in healthcare.
- Products sold into these segments, if differentiated, enjoy very long product life cycles.
- There are opportunities to generate profitable and predictable revenue annuities in services, consumables, and software.
Regulations present both challenges and opportunities. They create entry barriers for newcomers, causing long selling cycles that put pressure on the returns of new entrants. The high switching costs for customers, due to both validation costs and the risk of issues, provide a significant advantage for incumbents. If the products are consistent and the service is good, customers have little incentive to switch. Analysts often refer to the “moat” of incumbency and the “stickiness” of products, including capital, consumables, software, and services.
Challenges and Opportunities in Healthcare
At the scientific frontier of medicine and diagnostics, there are high-value technical problems to be solved, and tools often play an enabling role. Today these problems include things like metabolomics and proteomics for the development of therapies and routine diagnostics. This drives innovation, with the winners reaping the benefits of long-term revenue annuities.
Risks also exist for participants in this market. Price controls pose a threat to the investment required to bring innovations to market for both pharma companies and tools providers. The advent of AI and cloud technology has the potential to disrupt the space. The push for data aggregation across healthcare could lead to the commoditization of tools, with value capture shifting to enterprise-scale software.
Financial Analysis
Understanding the drivers of shareholder returns in the life science tools industry requires a nuanced approach. I began by looking at a cohort of eight companies: Thermo, Danaher, BioRad, Mettler Toledo, Repligen, Bruker, Agilent, Waters. Using publicly available data from the companies, the SEC and Yahoo Finance I built a database compiling quarterly data from the P&L, Balance Sheet and Statement of Cash Flows. I then did some fundamental comparisons looking for simple correlations of shareholder return with macroeconomics and company financials. My analysis, which includes a machine learning evaluation of financial data, reveals some intriguing patterns. These insights are just the tip of the iceberg, and I plan to delve deeper in future posts.
In each BLOG I will dive into a different analysis. I will post a summary in the BLOG with more detail on my website –https://mthopeconsulting.com/life-science-tools-blog/. I’m open to feedback and suggestions for where to take this work.
Stock Price Performance
To put things in context let’s first look at the stock prices of the eight companies over the past three years. I have used a moving average to filter the noise and normalized the companies and indices so I could compar
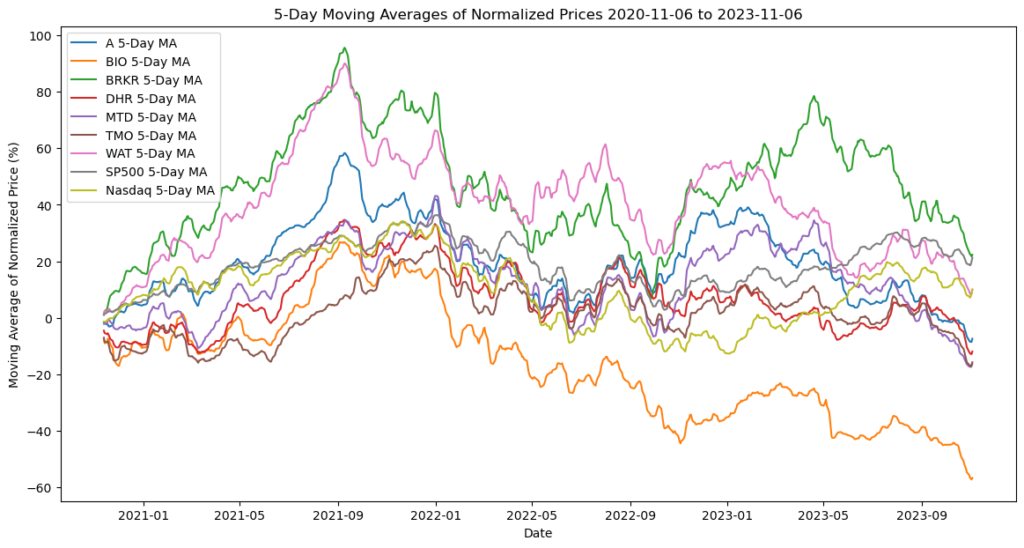
A few things jump out from this plot. BioRad is clearly having a tough time over the past five years. Only Waters and Bruker are close to the SP500 and Nasdaq over the time period. Agilent, Danaher, Mettler and Thermo are very tightly bunched.
To get a broader look, here is the same analysis for 10 years:
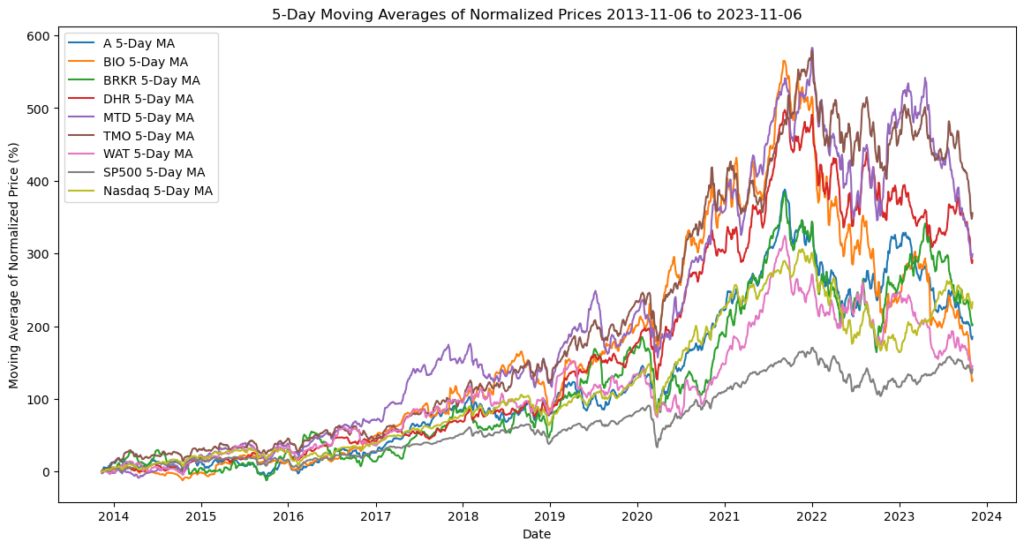
Clearly returns peaked in late 2021. All the companies have struggled since then.
Total Return to Shareholders
Next, I used the ‘adjusted close’ of the stock price to calculate the ‘Total Return to Shareholders’ – TSR. I’ve created an Index of the eight companies based on an average of the group’s performance.
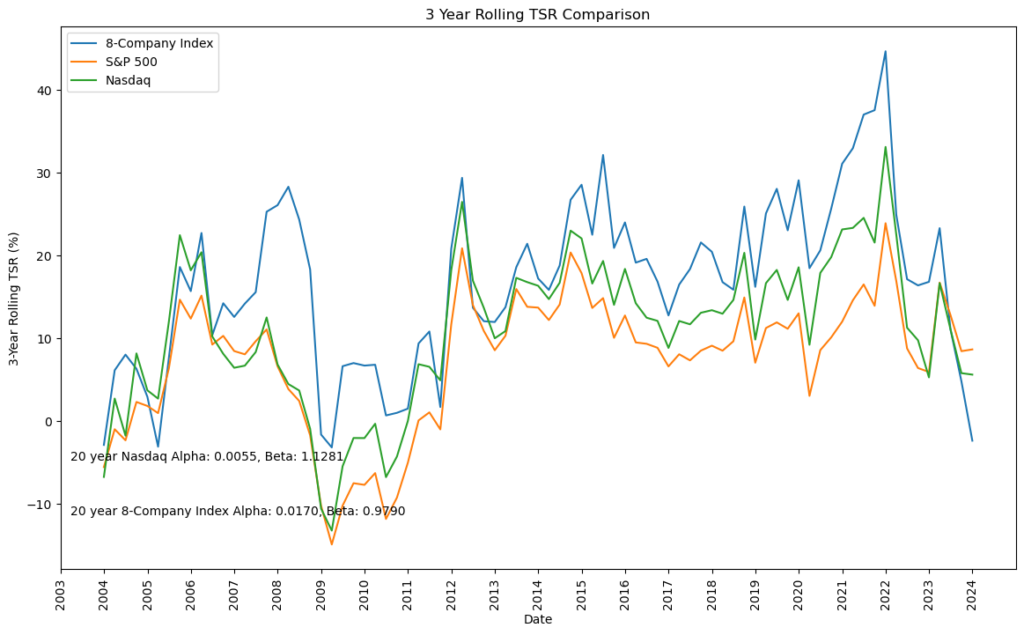
Immediately you can see that the eight-company index consistently delivered greater returns over 20 years. Additionally, I’ve added the 20-year alpha and beta for the eight-company index and the Nasdaq vs the SP 500. Interestingly, the eight-company index delivered better returns at lower volatility than the Nasdaq.
Next, let’s look at the individual company performance. This chart looks at the last five years by quarter. The three year TSR is calculated for each quarter for the preceding 3 years.
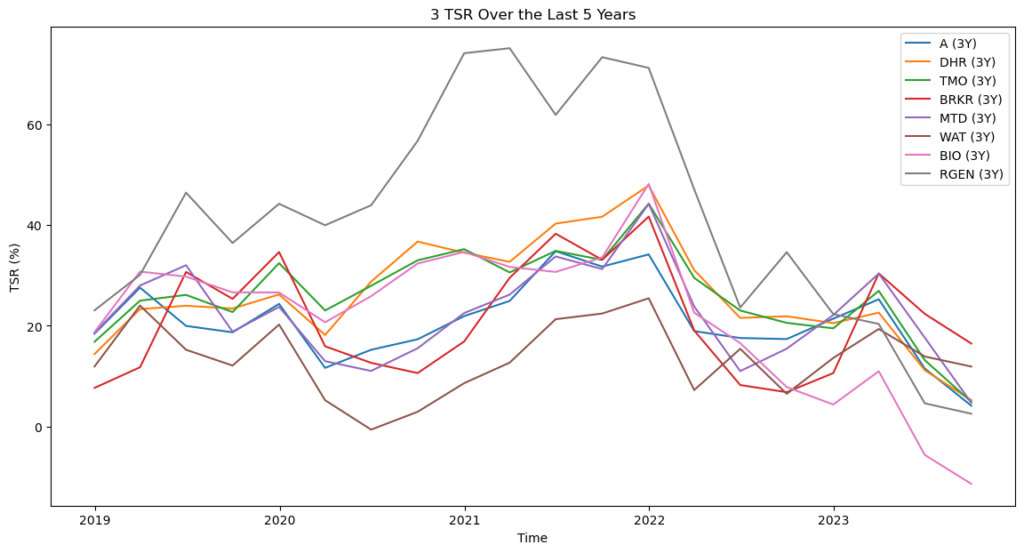
Repligen is the smallest company and has done the best job generating returns for shareholders. Waters clearly went through a tough period but is improving of late. BioRad has struggled recently. Bruker is outperforming everyone at the moment.
Conclusion
So what can we conclude from all this? The sector is clearly attractive for investment generating returns better than the SP500 and Nasdaq over the past twenty years. The companies have different portfolios and strategies, but life science is central to their business. Given the performance over the past 20 years, absent a major macroeconomic shock, I expect the segment to recover to historical returns.
For more detailed analyses and insights, I encourage you to visit my website. https://mthopeconsulting.com/life-science-tools-blog/. In my next blog post I’ll look into the drivers of TSR including the macroeconomic environment.
If you’re seeking tailored, expert consulting services to navigate this dynamic market, feel free to reach out to me directly.
If you found this blog interesting please complete thr form below and “click” the button.
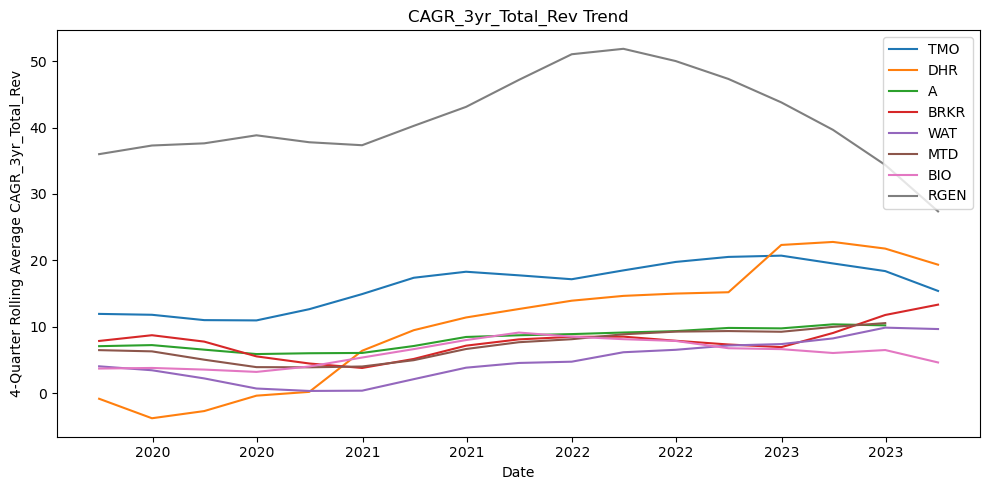
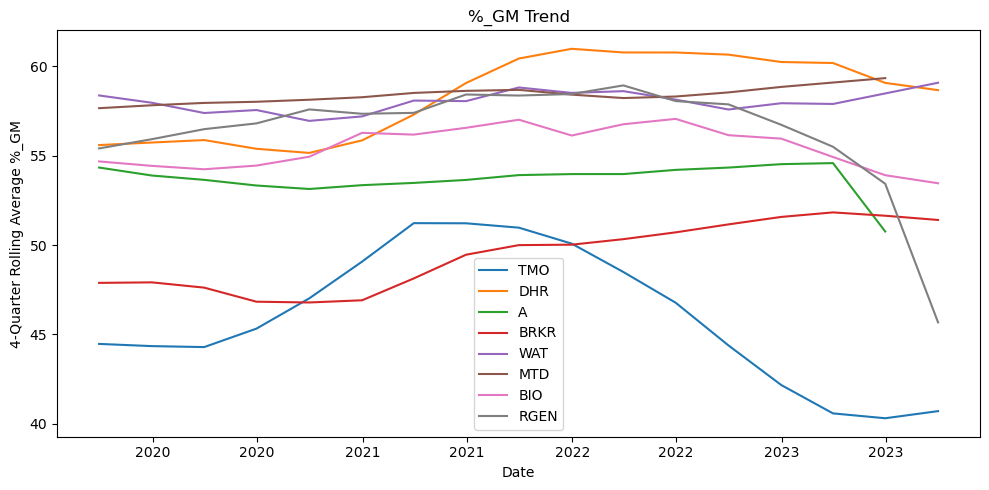
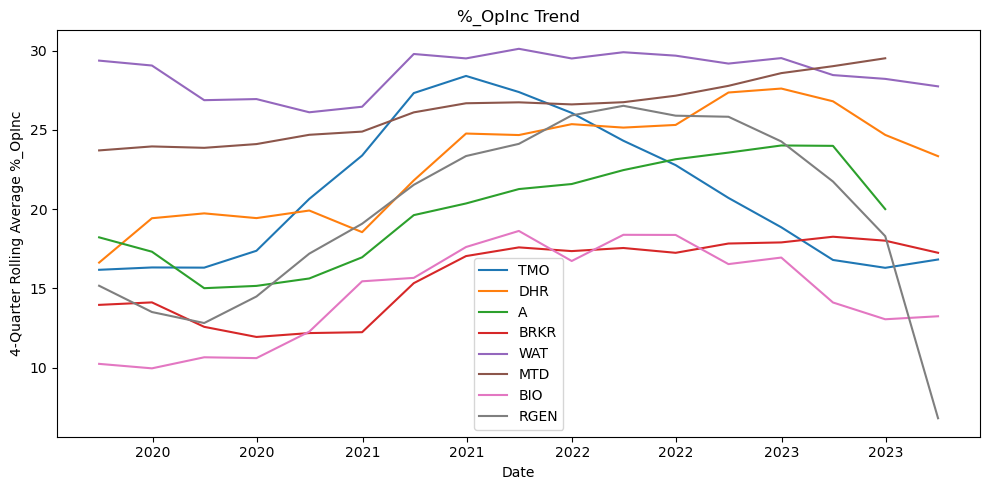
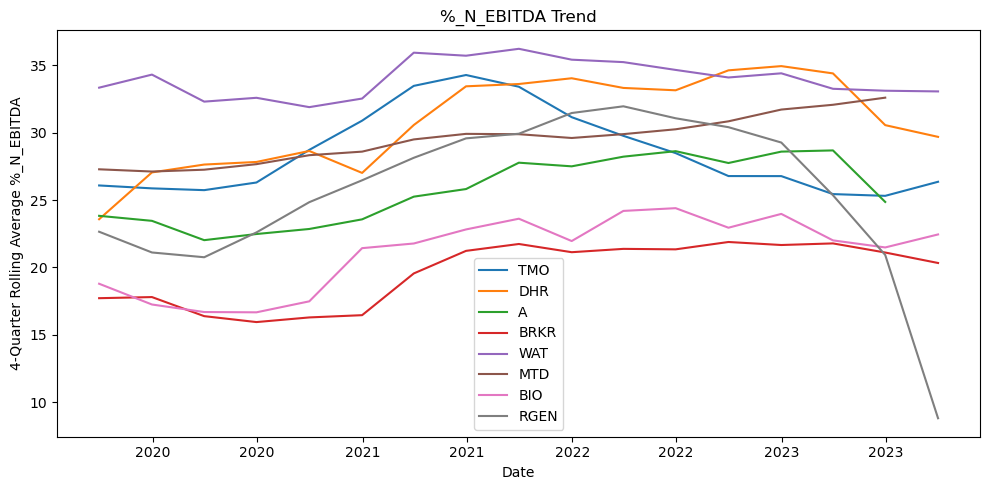
Additional Trend Plots
